4  Utilities

aka majordome.utilities

This module provides a set of utilities that are whether too general purpose for integrating another module or still waiting to find their definitive home. These include constants, type aliases, and functionalities of different kinds. Regarding this last kind of components, this tutorial aims at illustrating their use for practical documentation.

4.1 Plotting

4.1.1 MajordomePlot

One might ask why a wrapper around Matplotlib’s Figure and Axes is necessary, and I would strongly agree that it isn’t. However, keeping all the plots in a report consistent is a huge effort, and being able to standardize the plots without having to write new themes is a nice feature. That’s the main goal of MajordomePlot: simplifying the plotting of publication-quality figures across Majordome (and beyond!). Below we illustrate how to use this functionality to ensure all the plots in a project look the same.

MajordomePlot
MajordomePlot(
    shape : tuple[int, int] = (1, 1),
    style : str = 'classic',
    *,
    size : tuple[float, float] | None = None,
    xlabel : str | list[str] | None = None,
    ylabel : str | list[str] | None = None,
    opts : dict[str, typing.Any] = {'facecolor': 'white'}
    ) -> None:

Handles the creation and management of plots.

Provides a handle for creating and managing plots using Matplotlib. It is aimed at standardizing the plot creation process across the Majordome framework.

Parameters

shape : tuple[int, int] = (1, 1)

    Shape of the plot as (n_rows, n_cols).

style : str = 'classic'

    Matplotlib style to use for the plot.

size : tuple[float, float] | None = None

    Size of the plot in inches as (width, height). If None, the default size will be used.

xlabel : str | list[str] | None = None

    Label(s) for the x-axis. If a list is provided, each subplot will get its own label.

ylabel : str | list[str] | None = None

    Label(s) for the y-axis. If a list is provided, each subplot will get its own label.

opts : dict[str, typing.Any] = {'facecolor': 'white'}

    Additional options to pass to plt.subplots().


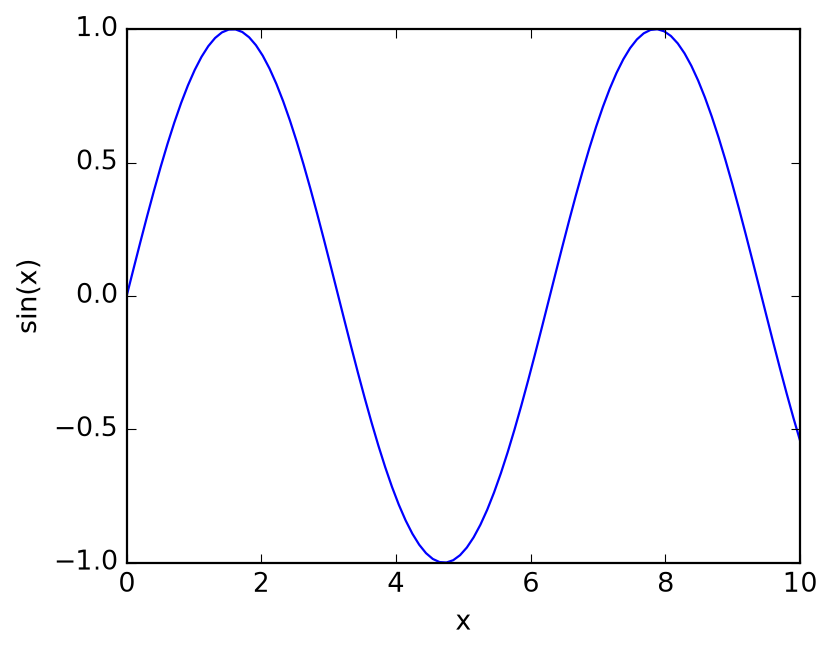
Let’s see how one would expect to use it from the above constructor signature. This is in fact almost the same as calling plt.subplots(), and that is what the constructor does under the hood. This is a negative example actually, the author has never used the constructor directly, but instead uses the new classmethod, which is a much more convenient way to create a plot. More on that later.

x = np.linspace(0, 10, 100)
mp = MajordomePlot(shape=(1, 1), size=(5, 4))
mp.axes[0].plot(x, np.sin(x))
mp.axes[0].set_xlabel("x")
mp.axes[0].set_ylabel("sin(x)")
pass

The story behind this class dates a few years back, when I was learning about Python decorators. As an exercise, I coded what later became the new classmethod, which is a decorator that creates a new MajordomePlot and passes it to the decorated function. This is a very convenient way to create plots, as it allows you to focus on the plotting code and not worry about the boilerplate of creating the plot and setting the labels.

new
new(
    cls : Any,
    _func : typing.Optional[typing.Callable[~Params, typing.Any]] = None,
    *,
    shape : tuple[int, int] = (1, 1),
    style : str = 'classic',
    sharex : bool = True,
    facecolor : str = 'white',
    grid : bool = True,
    size : tuple[float, float] | None = None,
    xlabel : str | list[str] | None = None,
    ylabel : str | list[str] | None = None
    ) -> typing.Callable[[typing.Callable[~Params, typing.Any]], typing.Any]:

Wraps a function for ensuring a standardized plot.

Parameters

_func : typing.Optional[typing.Callable[~Params, typing.Any]] = None

    Function to wrap, if any.

shape : tuple[int, int] = (1, 1)

    Shape of the plot as (n_rows, n_cols).

style : str = 'classic'

    Matplotlib style to use for the plot. By default “classic”.

sharex : bool = True

    Whether to share x-axis among subplots.

facecolor : str = 'white'

    Face color of the figure.

grid : bool = True

    Whether to display grid lines.

size : tuple[float, float] | None = None

    Size of the plot in inches as (width, height). If None, the default size will be used. By default None.

xlabel : str | list[str] | None = None

    Label(s) for the x-axis. If a list is provided, each subplot will get its own label. By default None.

ylabel : str | list[str] | None = None

    Label(s) for the y-axis. If a list is provided, each subplot will get its own label. By default None.


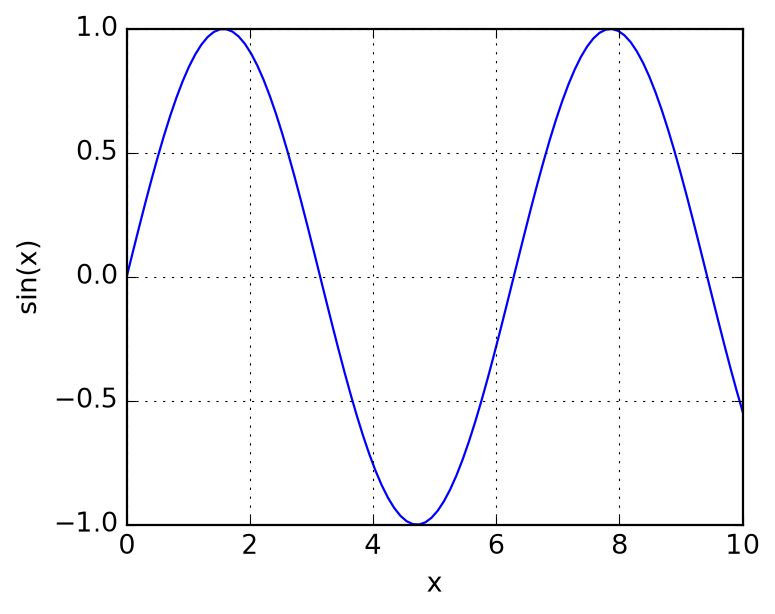
In the following example, we make use of this decorator to parametrize the labels of the plot. Internally, we must expect a keyword-only argument plot, which is the MajordomePlot instance created by the decorator, from which we can access the Figure and Axes objects as usual. The rest of the code is just standard Matplotlib code, with the exeption that the axes is raveled, so we can access it with ax[0] instead of ax[0, 0]. Returning plot is optional (it is done by the decorator already), but it avoids linting errors if you want to annotate the return type as MajordomePlot.

Here we create a function that will be used below in the examples. In summary, to get it working, you need to:

  • Use decorator @MajordomePlot.new with all its configurable attributes; for details, please refer to its API documentation.

  • Have a function with signature func(*args, plot=None, **kwargs) -> None, where it is recommended (for linter) to provide explictly keyword plot=None.

  • Unpack fig, ax = plot.subplots() or just _, ax = plot.subplots(), as needed, inside the figure; these contain standard matplotlib figure and axes.

@MajordomePlot.new(size=(5, 4), xlabel="x", ylabel="sin(x)")
def plot_sin(x, *, plot, **kwargs) -> MajordomePlot:
    _, ax = plot.subplots()
    ax[0].plot(x, np.sin(x))
    return plot

plot = plot_sin(np.linspace(0, 10, 100))

The following elements document the members and properties of the class.

add_curve
add_curve(
    self : Any,
    x : ArrayLike,
    y : ArrayLike,
    *args : Any,
    **kwargs : Any
    ) -> None:

Add a curve to the plot.

Parameters

x : ArrayLike

    X-axis values.

y : ArrayLike

    Y-axis values.

*args : Any

    Positional arguments to pass to Axes.plot().

kwargs : None = None

    Additional keyword arguments to pass to Axes.plot().


xlabel
xlabel(
    self : Any,
    label : str | list[str],
    **kwargs : Any
    ) -> None:

Add a label to the x-axis.

Parameters

label : str | list[str]

    Label for the x-axis.

kwargs : None = None

    Additional keyword arguments to pass to Axes.set_xlabel().


ylabel
ylabel(
    self : Any,
    label : str | list[str],
    **kwargs : Any
    ) -> None:

Add a label to the y-axis.

Parameters

label : str | list[str]

    Label for the y-axis.

kwargs : None = None

    Additional keyword arguments to pass to Axes.set_ylabel().


legend
legend(
    self : Any,
    **kwargs : Any
    ) -> None:

Add a legend to the plot.

Parameters

kwargs : None = None

    Additional keyword arguments to pass to Axes.legend().


xlim
xlim(
    self : Any,
    xmin : float,
    xmax : float,
    **kwargs : Any
    ) -> None:

Set the x-axis limits.

Parameters

xmin : float

    Minimum value of the x-axis.

xmax : float

    Maximum value of the x-axis.

kwargs : None = None

    Additional keyword arguments to pass to Axes.set_xlim().


ylim
ylim(
    self : Any,
    ymin : float,
    ymax : float,
    **kwargs : Any
    ) -> None:

Set the y-axis limits.

Parameters

ymin : float

    Minimum value of the y-axis.

ymax : float

    Maximum value of the y-axis.

kwargs : None = None

    Additional keyword arguments to pass to Axes.set_ylim().


resize
resize(
    self : Any,
    w : float,
    h : float
    ) -> None:

Resize a plot with width and height in inches.

Parameters

w : float

    Width of the plot in inches.

h : float

    Height of the plot in inches.


savefig
savefig(
    self : Any,
    filename : str | pathlib.Path,
    **kwargs : Any
    ) -> None:

Wrapper for saving a figure to file.

Parameters

filename : str | pathlib.Path

    Path to save the figure to.

kwargs : None = None

    Additional keyword arguments to pass to Figure.savefig().


subplots
subplots(self : Any): -> tuple[matplotlib.figure.Figure, list[matplotlib.axes._axes.Axes]]:

Provides access to underlying figure and axes.


show
show(self : Any): -> None:

Display the plot.


figure
figure(self : Any): -> Figure:

Provides access to underlying figure.


axes
axes(self : Any): -> list[matplotlib.axes._axes.Axes]:

Provides access to underlying axes.


4.1.2 PowerFormatter

PowerFormatter
PowerFormatter(**kwargs : Any): -> None:

Formatter for power of ten in numerical axes.

Parameters

values : str = None

    String of characters to be replaced by their superscript counterparts. By default “0123456789-”.

supers : str = None

    String of superscript characters corresponding to values. By default “⁰¹²³⁴⁵⁶⁷⁸⁹⁻”.


4.1.3 General utilities

centered_colormap
centered_colormap(
    name : str,
    vmin : float,
    vmax : float,
    vcenter : float = 0.0
    ) -> LookupTable:

Ensure the center of a colormap is at zero.

Parameters

name : str

    Name of the colormap to use.

vmin : float

    Minimum value of the data range.

vmax : float

    Maximum value of the data range.

vcenter : float = 0.0

    Center value of the colormap, by default 0.


4.2 LaTeX

Upcoming…

4.3 PDF Tools

4.3.1 PdfToTextConverter

Below we illustrate the usage of PdfToTextConverter. Please notice that data curation of extracted texts is still required if readability is a requirement. If quality of automated extractions is often poor for a specific language, you might want to search the web how to train tesseract, that topic is not covered here.

Note: this note assumes tesseract and poppler, and ImageMagick are available in system path. Under Windows you might struggle to get them all working together, please check Majordome’s Kompanion for automatic installation.

Install dependencies on Ubuntu 22.04:

sudo apt install tesseract-ocr imagemagick poppler-utils

In case of Rocky Linux 9:

sudo dnf install tesseract tesseract-langpack-eng ImageMagick poppler-utils

Assuming the dependencies are found in the path, it is simply a matter of creating a converter:

try:
    converter = PdfToTextConverter()
except:
    class _PdfToTextConverter:
        @property
        def meta(self):
            return {"failed": True}

        @property
        def content(self):
            return "Missing Tesseract or Poppler"

        def __call__(self, fname, **kwargs):
            return self

    converter = _PdfToTextConverter()

For generated PDF (not scanned documents), it is much faster to avoir using OCR; below we show the metadata from a paper:

data = converter("../data/pdftools/paper.pdf", use_ocr=False)
data.meta
{'failed': True}

For scanned documents, by default if OCR is not enabled it will be used as a fallback method for text extraction:

data = converter("../data/pdftools/scanned.pdf", last_page=1)
data.content[:500]
'Missing Tesseract or Poppler'

4.4 Argument parsing

4.4.1 FuncArguments

def f(*args, **kwargs):
    """ Arbitrary interface function for illustration. """
    f.parser.update(*args, **kwargs)

    try:
        print(f"a = {f.parser.get('a')}, b = {f.parser.get('b')}")
        f.parser.close()
    except Exception as err:
        print(err)
        pass
  • Arguments are both positional-mandatory
f.parser = FuncArguments()
f.parser.add("a", index=0)
f.parser.add("b", index=1)

f(3)
f(3, 4)
Cannot retrieve mandatory positional argument at position 1
a = 3, b = 4
  • Arguments are both keyword-only
f.parser = FuncArguments()
f.parser.add("a", default="foo")
f.parser.add("b", default="bar")

f(3)
f(3, 4)
f(3, b=4)
f(a=3, b=4)
a = foo, b = bar
Too many positional arguments, got 1 but only 0 were used.
a = foo, b = bar
Too many positional arguments, got 2 but only 0 were used.
a = foo, b = 4
Too many positional arguments, got 1 but only 0 were used.
a = 3, b = 4
  • One positional and another (maybe) positional
f.parser = FuncArguments()
f.parser.add("a", index=0)
f.parser.add("b", index=1, default=6)

f(3)
f(3, 4)
f(3, 4, b=4)
a = 3, b = 6
a = 3, b = 4
Cannot have both positional and keyword version of b (1) simultaneously
  • Badly configured
f.parser = FuncArguments()

try:
    f.parser.add("a")
    f.parser.add("b")
except Exception as err:
    print(err)
Argument must be either positional or keyword, cannot be neither: a

4.4.2 Creating class constructors

You should probably not do this, but it is quite fun!

def _init_some_class(cls):
    """ Decorator to enhance SomeClass with argument parsing. """
    orig_init = cls.__init__

    # Maybe stash for later use?
    # cls.__orig_init__ = orig_init

    parser = FuncArguments(greedy_args=False, pop_kw=True)
    parser.add("a", 0)
    parser.add("x", default=None)

    @functools.wraps(orig_init)
    def new_init(self, *args, **kwargs):
        parser.update(*args, **kwargs)
        a = parser.get("a")
        x = parser.get("x")

        orig_init(self, *parser.args, **parser.kwargs)
        parser.close()

        # -- logic goes here
        print(f"some a = {a}")
        print(f"some x = {x}")

        return None

    cls.__init__ = functools.update_wrapper(new_init, orig_init)
    return cls
class BaseClass:
    def __init__(self, *args, **kwargs) -> None:
        print(f"args   = {args}")
        print(f"kwargs = {kwargs}")
@_init_some_class
class SomeClass(BaseClass):
    def __init__(self, *args, **kwargs) -> None:
        super().__init__(*args, **kwargs)
some = SomeClass(1, 2, 3, x=1, y=2)
args   = (1, 2, 3)
kwargs = {'y': 2}
some a = 1
some x = 1

4.5 Markdown

4.5.1 Normalize LaTeX delimiters

apply
apply(
    cls : Any,
    text : str
    ) -> str:

Apply normalization to the given text.

Parameters

text : str

    The input Markdown text to normalize.


apply_token_list
apply_token_list(
    cls : Any,
    tokens : list[markdown_it.token.Token],
    inplace : bool = True
    ) -> tuple[list[markdown_it.token.Token], int]:

Apply LaTeX delimiter normalization to all applicable tokens.

Parameters

tokens : list[markdown_it.token.Token]

    The token stream to process.

inplace : bool = True

    Whether to modify the tokens in place or return a new list (default is True).


The following illustrates the use of the functionality:

sample = r"""
Inline good: \( x^2 + y^2 \)

Inline missing slash: \(a+b)

Inline missing slash close: (c+d\)

Inline parenthetized: (\(c+d\))

Inline breaking case: \( V_{IJ}^{(n)} \)

Block inline: \[ \int_0^1 f(x)\,dx ]

Fragilized block:

\[ \int_0^1 f(x)\,dx ]

I noticed that sometimes links may be fragile, like in:

![diagram showing something](../assets/img/favicon-32x32.png)

What about this doubly escaped inline math: \\( \\Delta J \\) ?

\\[
W_{\\text{point}}^{(n)} = \\left( W_{AA}^{(n)} + W_{BB}^{(n)} -
      2W_{AB}^{(n)} \\right)
\\]
"""

normalizer = LatexDelimiterNormalizer()
output = normalizer.apply(sample)
display(Markdown(output))

Inline good: \(x^2 + y^2\)

Inline missing slash: \(a+b\)

Inline missing slash close: \(c+d\)

Inline parenthetized: (\(c+d\))

Inline breaking case: \(V_{IJ}^{(n)}\)

Block inline: \[ \int_0^1 f(x)\,dx \]

Fragilized block:

\[ \int_0^1 f(x)\,dx \]

I noticed that sometimes links may be fragile, like in:

diagram showing something

What about this doubly escaped inline math: \(\Delta J\) ?

\[ W_{\text{point}}^{(n)} = \left( W_{AA}^{(n)} + W_{BB}^{(n)} - 2W_{AB}^{(n)} \right) \]

4.6 Common

4.6.1 ColorPrint

red
red(text : Any): -> None:

Print text in red color.

Parameters

text : Any

    Text (or object with text conversion) to print.


green
green(text : Any): -> None:

Print text in green color.

Parameters

text : Any

    Text (or object with text conversion) to print.


blue
blue(text : Any): -> None:

Print text in blue color.

Parameters

text : Any

    Text (or object with text conversion) to print.


yellow
yellow(text : Any): -> None:

Print text in yellow color.

Parameters

text : Any

    Text (or object with text conversion) to print.


cyan
cyan(text : Any): -> None:

Print text in cyan color.

Parameters

text : Any

    Text (or object with text conversion) to print.


ColorPrint.red("This is a red message.")
ColorPrint.green("This is a green message.")
ColorPrint.blue("This is a blue message.")
ColorPrint.yellow("This is a yellow message.")
ColorPrint.cyan("This is a cyan message.")
This is a red message.

This is a green message.

This is a blue message.

This is a yellow message.

This is a cyan message.

4.6.2 ArchitecturalFormatUSParser